Case study · Canadian DTC · 30 days
Flow revenue up 57% in 30 days after rebuilding the lifecycle engine.
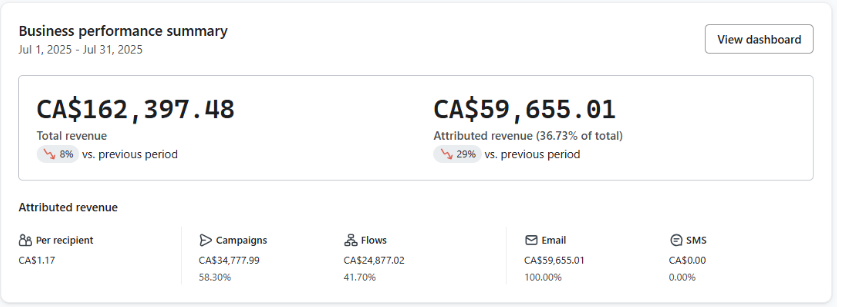
flow revenue (CA$15,802 → CA$24,877)
flow share of email revenue
live flows
The starting point
In June 2025, 81% of attributed email revenue came from campaigns and only 19% from flows. Buyers were active and traffic was strong, but revenue capture followed the calendar instead of customer behavior.
What we built
- Live flows went from 12 to 22, covering welcome, browse and site abandonment, cart, thank-you, two tiers of cross-sell, two tiers of upsell and reorder reminders
- Segments that protect deliverability: engaged non-buyers, first-time and repeat buyers, a 120-day zero-open group and a sunset list, with refined exclusions so flows don’t overlap
- Clearer messages: confidence over urgency, 3 to 6 proven products per email, simple Light, Balanced and Bold categories, and cleaner layouts
The results
Flow revenue rose from CA$15,802 in June to CA$24,877 in July, up 57.4%. The flow share of attributed revenue more than doubled, from 19% to 41.7%, even though total store revenue dipped 6% that month.
Total store revenue fell 6% that month. Flow revenue still rose 57%.
Want this system running in your store?
Start with a free email audit. We record a video review of your flows, segments and deliverability within five business days. Plans from $1,500 a month, month-to-month.
More case studies
Other results from real accounts.
attributed to email in 12 months, 91% from flows, through a six-week shutdown.
US cannabis DTC$434,056in 9 months, 74% from flows. Email is now about 29% of total store revenue.
Recreational DTC · $3.14 per recipient$0 → $203kin 4 months from a 302-subscriber list, 95% from flows.
Recreational DTC launch$140,521in 7 months after moving revenue from campaigns to automation. 80% from flows.
DTC brand · 86/100 deliverability